AI Picks Come Back for the Description. Blue Yonder Counted Shoppers, Not Parcels.
Americans who returned an AI-recommended purchase most often said it was 'different than described', while wrong size or fit leads returns overall, Blue Yonder's 2026 returns survey finds. Its 46% headline counts shoppers with at least one such return, and at an ordinary online return rate three AI-picked purchases a year would produce about the same figure.
Neritus Vale
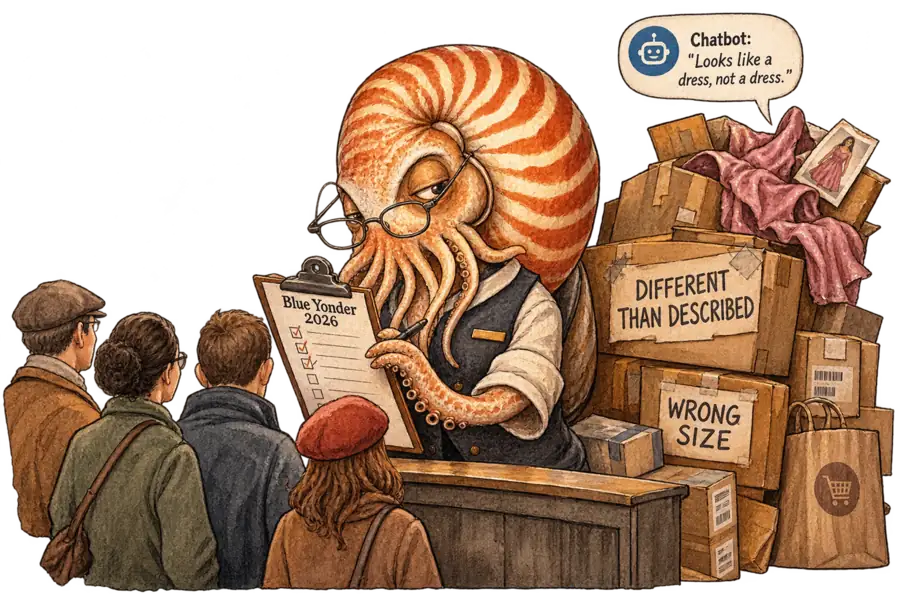
Blue Yonder’s 2026 returns survey finds AI-recommended purchases coming back for a different reason from other returns. Among Americans who sent back an AI assistant’s pick, the leading complaint was “different than described”; across all American returns, wrong size or fit leads. Whether AI picks come back more often, the survey cannot say. Its headline figure, 46%, counts shoppers who returned at least one AI pick in a year; the share of AI picks sent back appears nowhere.
The headline describes a minority of the American sample. A third-party provider polled 2,000 Americans in September, alongside consumers in Australia, France, Germany and the UK, the release says. The AI headline leaves most of them out. Only 24% had bought a product on an AI assistant’s recommendation.
The reasons rest on a subgroup of that minority. They are shares of the Americans who had returned an AI pick: roughly 220 people, by the release’s percentages. At that size each share carries a margin of about six points, and the survey publishes none. The most common answer, “different than described”, drew 36%, Blue Yonder reports.
The comparison that casts description as AI’s weak spot sits on a different base. Size or fit came second among AI returners, at 23%. The release’s diagnosis rests on the ranking reversing for returns in general. For American returns overall, fit leads at 42%, but the infographic’s footnote defines that figure as the most common reason for returning any purchase, among all U.S. respondents. The two shares answer different questions, put to groups of very different size.
Neither figure says what was bought. Size and fit presumably matter most for clothes and shoes, and the release does not say how many AI picks were either. A basket heavy in gadgets would push fit down the list even with sound recommendations. For a fashion retailer, the question is why AI-picked clothes come back, and the survey cannot answer it.
The clearest reading of the Australian figures appears in an article on iTWire that is bylined to Blue Yonder itself. It reports that 45% of Australian AI buyers had returned an AI pick. It calls the finding indicative, since it rests on a small subgroup of the 250 Australians surveyed. The figure does not establish causation, the article adds, and it “measures shoppers who made a return, rather than the proportion of AI-recommended purchases returned”.
Several other write-ups turned shoppers into parcels. DC Velocity’s headline has AI shoppers who “have returned what they bought”, and its story says retailers “could soon be dealing with increasing volumes of returns”. Retail Dive’s headline went further, to cause: “AI recommendations are leading to returns”. Even Blue Yonder’s own blog says the 46% “returned the product”. The AI findings are new this year, the release’s FAQ says, so Blue Yonder has no earlier figure for any volume to rise from.
A claim about volume needs a different fraction, counted from order lines: AI-picked items returned over AI-picked items bought, beside the same fraction for everything else. The NRF and Happy Returns, a UPS company, estimated that 19.3% of online sales would be returned in 2025.
At an ordinary online return rate, the headline needs no AI effect at all. On simple probability, three AI-picked purchases a year, each as likely to go back as the average online sale, would leave a shopper with at least one return 47% of the time. The sum is crude: it gives every shopper the same chance on every purchase, and NRF’s figure is a share of sales, not a per-order probability. Real shoppers vary, which would lower the odds. The survey’s base also takes in anyone who has ever bought on an AI recommendation, while the return window is a single year, which probably pulls the true figure down. The release publishes no count of how many AI picks anyone bought.
A busy shopper and a bad recommendation can produce the same 46%.
The best objection is that Blue Yonder did compare. Its FAQ answers “Do consumers return AI-recommended products more?” by setting the headline beside 41% for shoppers who bought on social-media recommendations. That gap means AI picks fail more often only if both groups bought about the same number of recommended items.
Nothing in the release shows the two groups bought alike. By the same arithmetic, AI buyers making less than half an extra recommended purchase a year would produce the whole gap. Shopping habits alone could account for it. The FAQ’s other figure is a self-assessment: 49% of AI returners say they are likelier to return AI picks than direct purchases, and only 9% say less likely. Its base is people who had already sent one back.
Blue Yonder reads the description finding as a data problem. “That’s not really an AI problem. It’s a data problem,” Duncan Angove, its chief executive, says in the release. Most product data, he argues, “was written for a search bar, not for a machine suggesting products for someone”.
Blue Yonder sells software for returns, and its route to better product data runs through a partner; that pairing is an inference, since the returns release never mentions Syndigo. The release links to Blue Yonder Returns Management, extended in 2025 by buying the returns-technology firm Optoro. A May partnership brings Syndigo’s product content into Blue Yonder’s platform for Syndigo licensees. That announcement is mostly about planning, onboarding and planograms, with one line on agents: an AI agent will “favor items with the most accurate, complete and enriched product data”.
The description finding matters more than the headline, because a description return tells an agent something a fit return does not. A 3 November arXiv paper from researchers at Tsinghua University and Tencent models agents that gather recommendations from competing platforms on a user’s behalf. The platforms may dress up an item’s description without changing the item. Each agent judges a platform’s credibility only from what its user consumed.
Without such a credibility check, the authors find an equilibrium in which every platform claims the highest possible relevance, so descriptions stop telling items apart. In a simulated market built from Amazon’s musical-instrument reviews, with a similarity score standing in for user value, the check corrected some overstatement, yet the interval around its net gain included zero. Users did no better on average than by staying put. In the paper’s synthetic market the same check did lift utility, and the authors call the answer conditional.
A product return is the retail version of that feedback, though the paper never discusses one. On this reading, a fit return reports mostly on the shopper’s body, while a description return reports on the retailer’s copy. If agents start keeping score this way, product data written to win the pick will be graded at the unboxing. Retailers write the copy, so the grade is in their hands.