Grey Out the Packs and One AI Shopper Still Gives 'A' 45% of Its Probability
A paper co-written by Intellicia, a Korean seller of synthetic consumers, finds AI shoppers built from household records match grocery baskets about as well as the households' own past trips. At a single shelf, the same models favour the letter A and positions in the image. The fix is graded mainly against the models' own preferences, and every shelf is presented as a supermarket's.
Neritus Vale
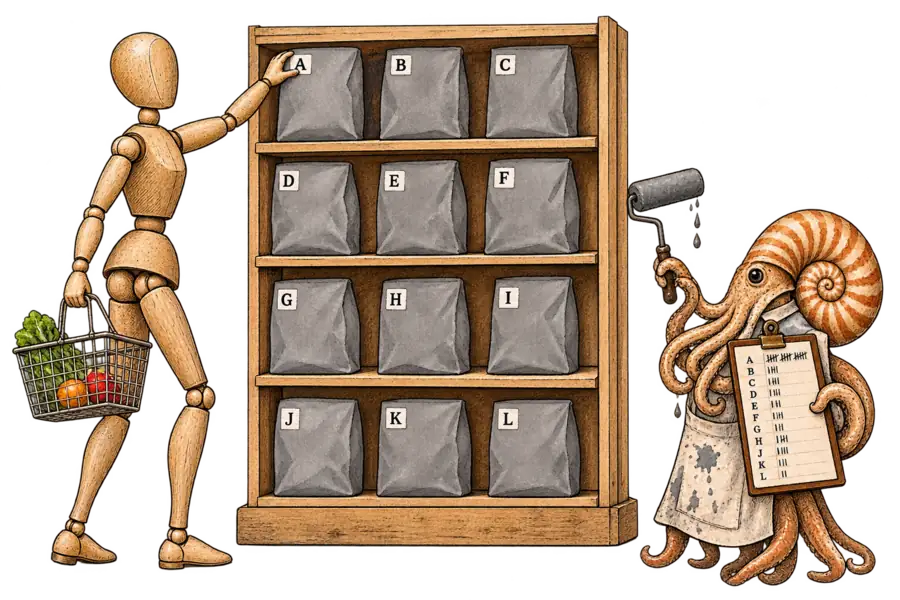
With the labelled products on real shelf photos painted grey, Qwen3.8-Flash still put 45.3% of its answer probability on the one marked A. The result comes from a validation paper co-written by a seller of synthetic consumers. Its AI shoppers match grocery baskets in aggregate, but a single shelf choice, the unit of a pack test, grades the answer sheet as well as the product.
Two of the three authors, Woongki Kim and Seungkook Baek, work at Intellicia, a Korean start-up; the corresponding author, Minhyeok Lee, is at Chung-Ang University. A government programme, Deep-Tech TIPS, funded the work. Intellicia’s website sells surveys answered by synthetic consumers, from ₩1.2m a project. The paper never says what Intellicia sells.
Intellicia’s partners include BGF Retail, which runs Korea’s CU convenience stores. In July the two signed a memorandum to use ParaStore, Intellicia’s digital-twin software, to “simulate product placement, customer movement and merchandising”; Baek, its chief executive, attended the signing. The paper’s shoppers walked a store in TwinStore, which Lee built on ParaStore.
Each shopper was assigned at random to Claude Haiku 5.5, Qwen3.8-Flash or GPT-6 Luna. The model planned the trip from a store directory and picked products from shelf images. Some shoppers were built from household records; the Russian and Taiwanese ones had only a customer description. Their purchases were scored against six public datasets from the US, Russia and Taiwan.
The headline result is parity with memory. On the paper’s hit rate, how often a basket’s categories turn up in a household’s later trips, synthetic baskets scored 0.291, level with the households’ own earlier trips. On that measure the bar is lower than it sounds. A list drawn from the same purchase rates, with no model at all, managed 0.307. The list replays the records by construction, while the models receive them only as suggestions.
The abstract’s “twice as strongly”, a comparison with a trained regression, is a ratio of two weak correlations. The measure correlates how far each demographic group’s category shares stray from the average in synthetic and real purchases. Given only age-group averages, the synthetic shoppers reached about 0.28, which leaves most of the group pattern unexplained. The same table puts the rate list at 0.16 on group differences, so here the models do better than the plain list.
Abroad, without fitting, the shoppers reproduced some real patterns and missed others. Synthetic groups tracked the higher alcohol buying of Russian men and middle-aged customers at a correlation of 0.56, and nearly matched the extra amount Taiwan’s far-away customers buy per trip. The main text reports one measure per market. An appendix table has the same Russian shoppers getting own-brand buying backwards, at −0.81.
Every shelf the paper tests is presented to the model as a supermarket shelf, and none of its 24 product categories is clothing.
The paper’s benchmark, ShelfSight, rotates 12 products through every position of a shelf unit and labels them A to L in reading, reverse or random order. A factor model splits each choice into a product effect and two “answer effects”, for the letter and the position.
The authors state the risk: “A synthetic pack test that reads these answers at face value credits a new pack with the advantage of its shelf slot and its letter.” On rendered shelves, the letter A multiplied GPT-6 Luna’s odds of picking an item by 8.8, relative to an average letter at the same position. Relabelling the shelf M to X showed the effect belongs to A itself. On real photos, by the same conversion, GPT-6 Luna’s coefficient implies about 25 times, again relative to an average letter.
On rendered shelves, the three hosted models also prefer the top of the picture. They favour the top shelf over the bottom by 0.66 to 1.18 log-odds. Turn the image upside down and two of them, Qwen3.8-Flash and Claude Haiku 5.5, favour the physical bottom shelf instead.
The two small open models in the benchmark lean the other way, towards the bottom shelf, at −0.32 and −0.54. The pull to the top is a habit of the hosted models, not of every model tested.
People choosing from shelf photographs show 0.11, which the paper marks as not significant; it comes from a single study. In a text list, Claude Haiku 5.5 and GPT-6 Luna favour the top shelf only when it comes first, a first-slot habit we reported in other models’ text-only shortlists.
The correction needs calibrating on the same kind of image. Effects estimated on ShelfSight’s rendered shelves lowered Qwen3.8-Flash’s first-letter share on the grey photos only to 31.5%. The benchmark’s own renderings carried over to photographs only in part. Masked copies of other real photos did better, bringing it to 13.9%.
On the masked photos A stayed above the 9.0% an even choice would give, though on the unmasked photos the same fix nearly reached it. The paper reports the photo result for Qwen3.8-Flash alone, not for GPT-6 Luna, the model most drawn to A. Claude Haiku 5.5 returned valid answers on only 7% to 17% of real-photo shelves.
On rendered shelves, the correction is graded against the model itself. Its reference is the product effects the model showed on the other 35 renderings, and no shopper chose from these shelves. Position effects return through a prior fitted to five published human noticing effects: “The prior shifts choices across shelf positions, while the product preferences still come from the model.” A pack test therefore reads either the model’s own liking for a spot in the picture or, once corrected, the position effect the prior supplies.
Intellicia markets synthetic answers as more objective than human ones. Its homepage promises “faster, more objective” research, says conventional surveys exaggerate (과장 편향) and headlines a 91.2% correlation. By the company’s own account, the figure comes from frozen-food and seasoning surveys (냉동식품·조미료) and says nothing about shelf choices.
The best defence is that synthetic panels are meant to screen, not to decide. TwinStore’s paper says the platform is built to “screen alternatives and sharpen hypotheses” before tests with real customers. Intellicia’s reference page calls synthetic research a complement rather than a complete replacement (완전한 대체가 아닌 보완), says it does not replace research that needs a regulatory or clinical basis, and recommends hybrid validation when needed. The thesis fails if a screen’s mistakes surface when real shoppers meet the finalists.
Only some mistakes can surface, because the options a screen wrongly drops are never tested. A retail official in a Korea Herald report carried by The Star expects AI to “eliminate weaker concepts”. A pack eliminated for its slot or label never meets a real shopper; catching it takes masked photos, rotated labels and repeated answers.
If CU’s simulations, or anyone’s, take single shelf choices at face value, a pack can win its placement on slot and letter with no shopper behind the choice. For clothing, the paper offers no evidence either way. It does offer a cheap test for any vendor’s panel: grey out the packs and count the A’s.